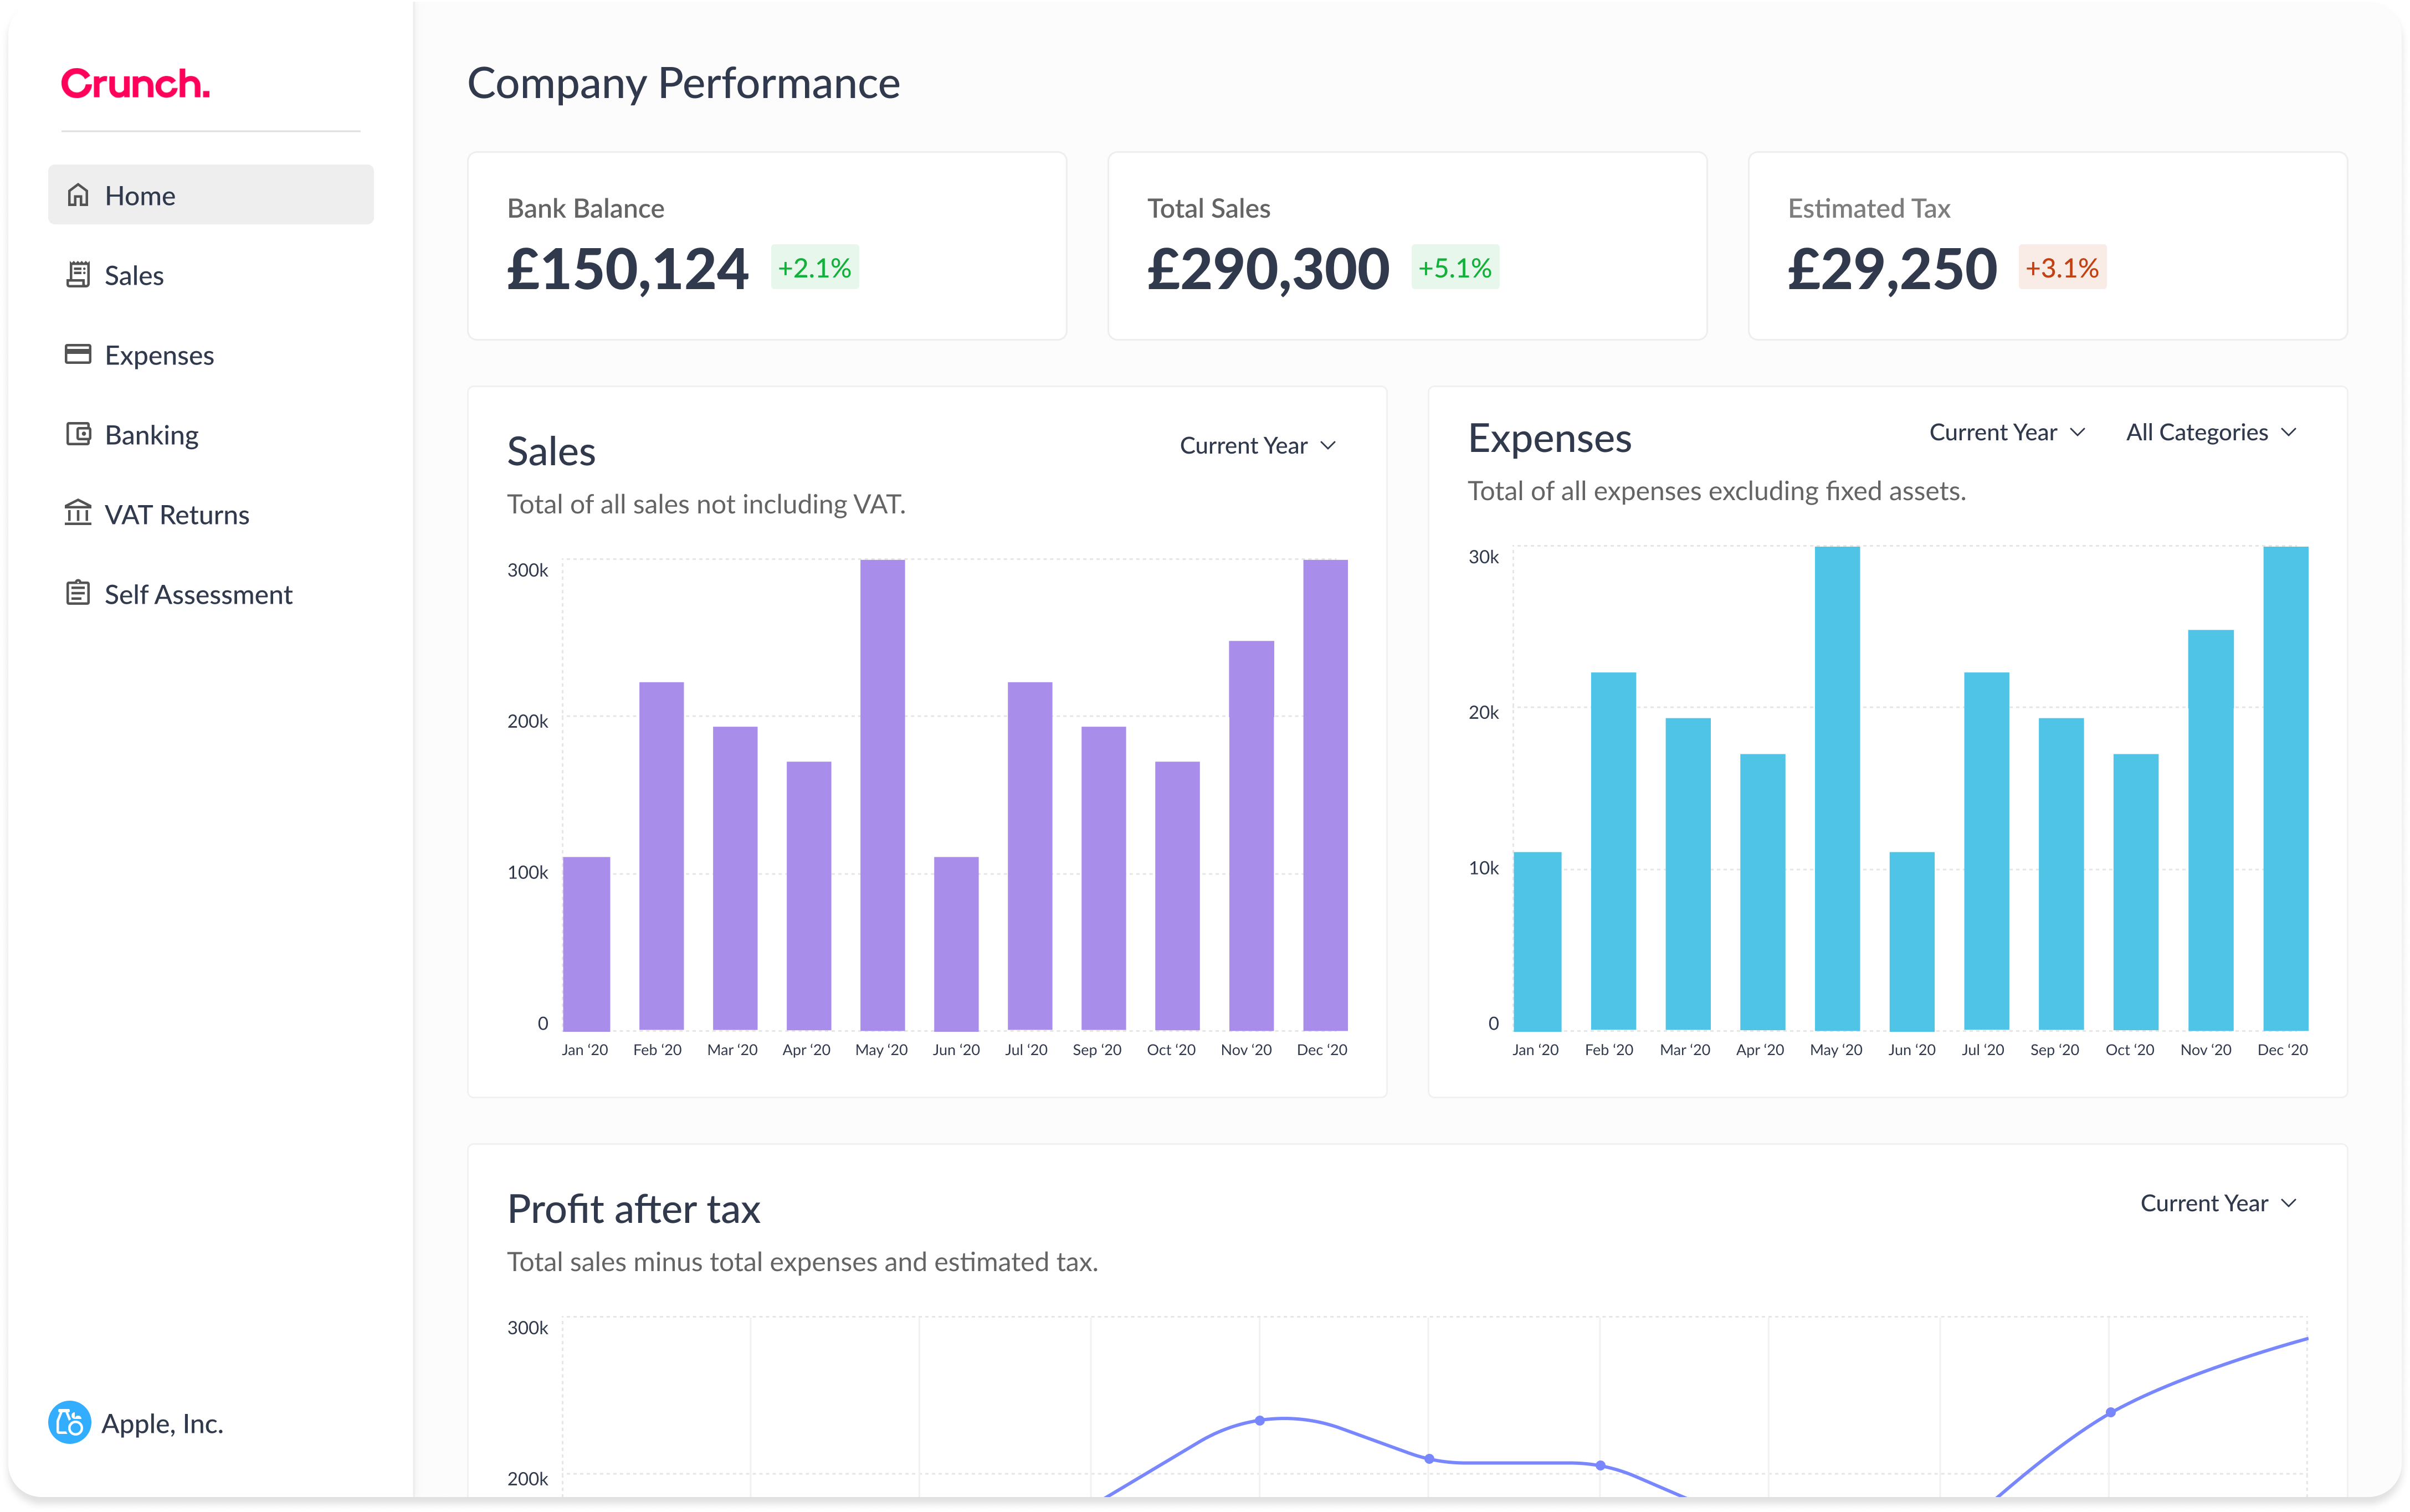
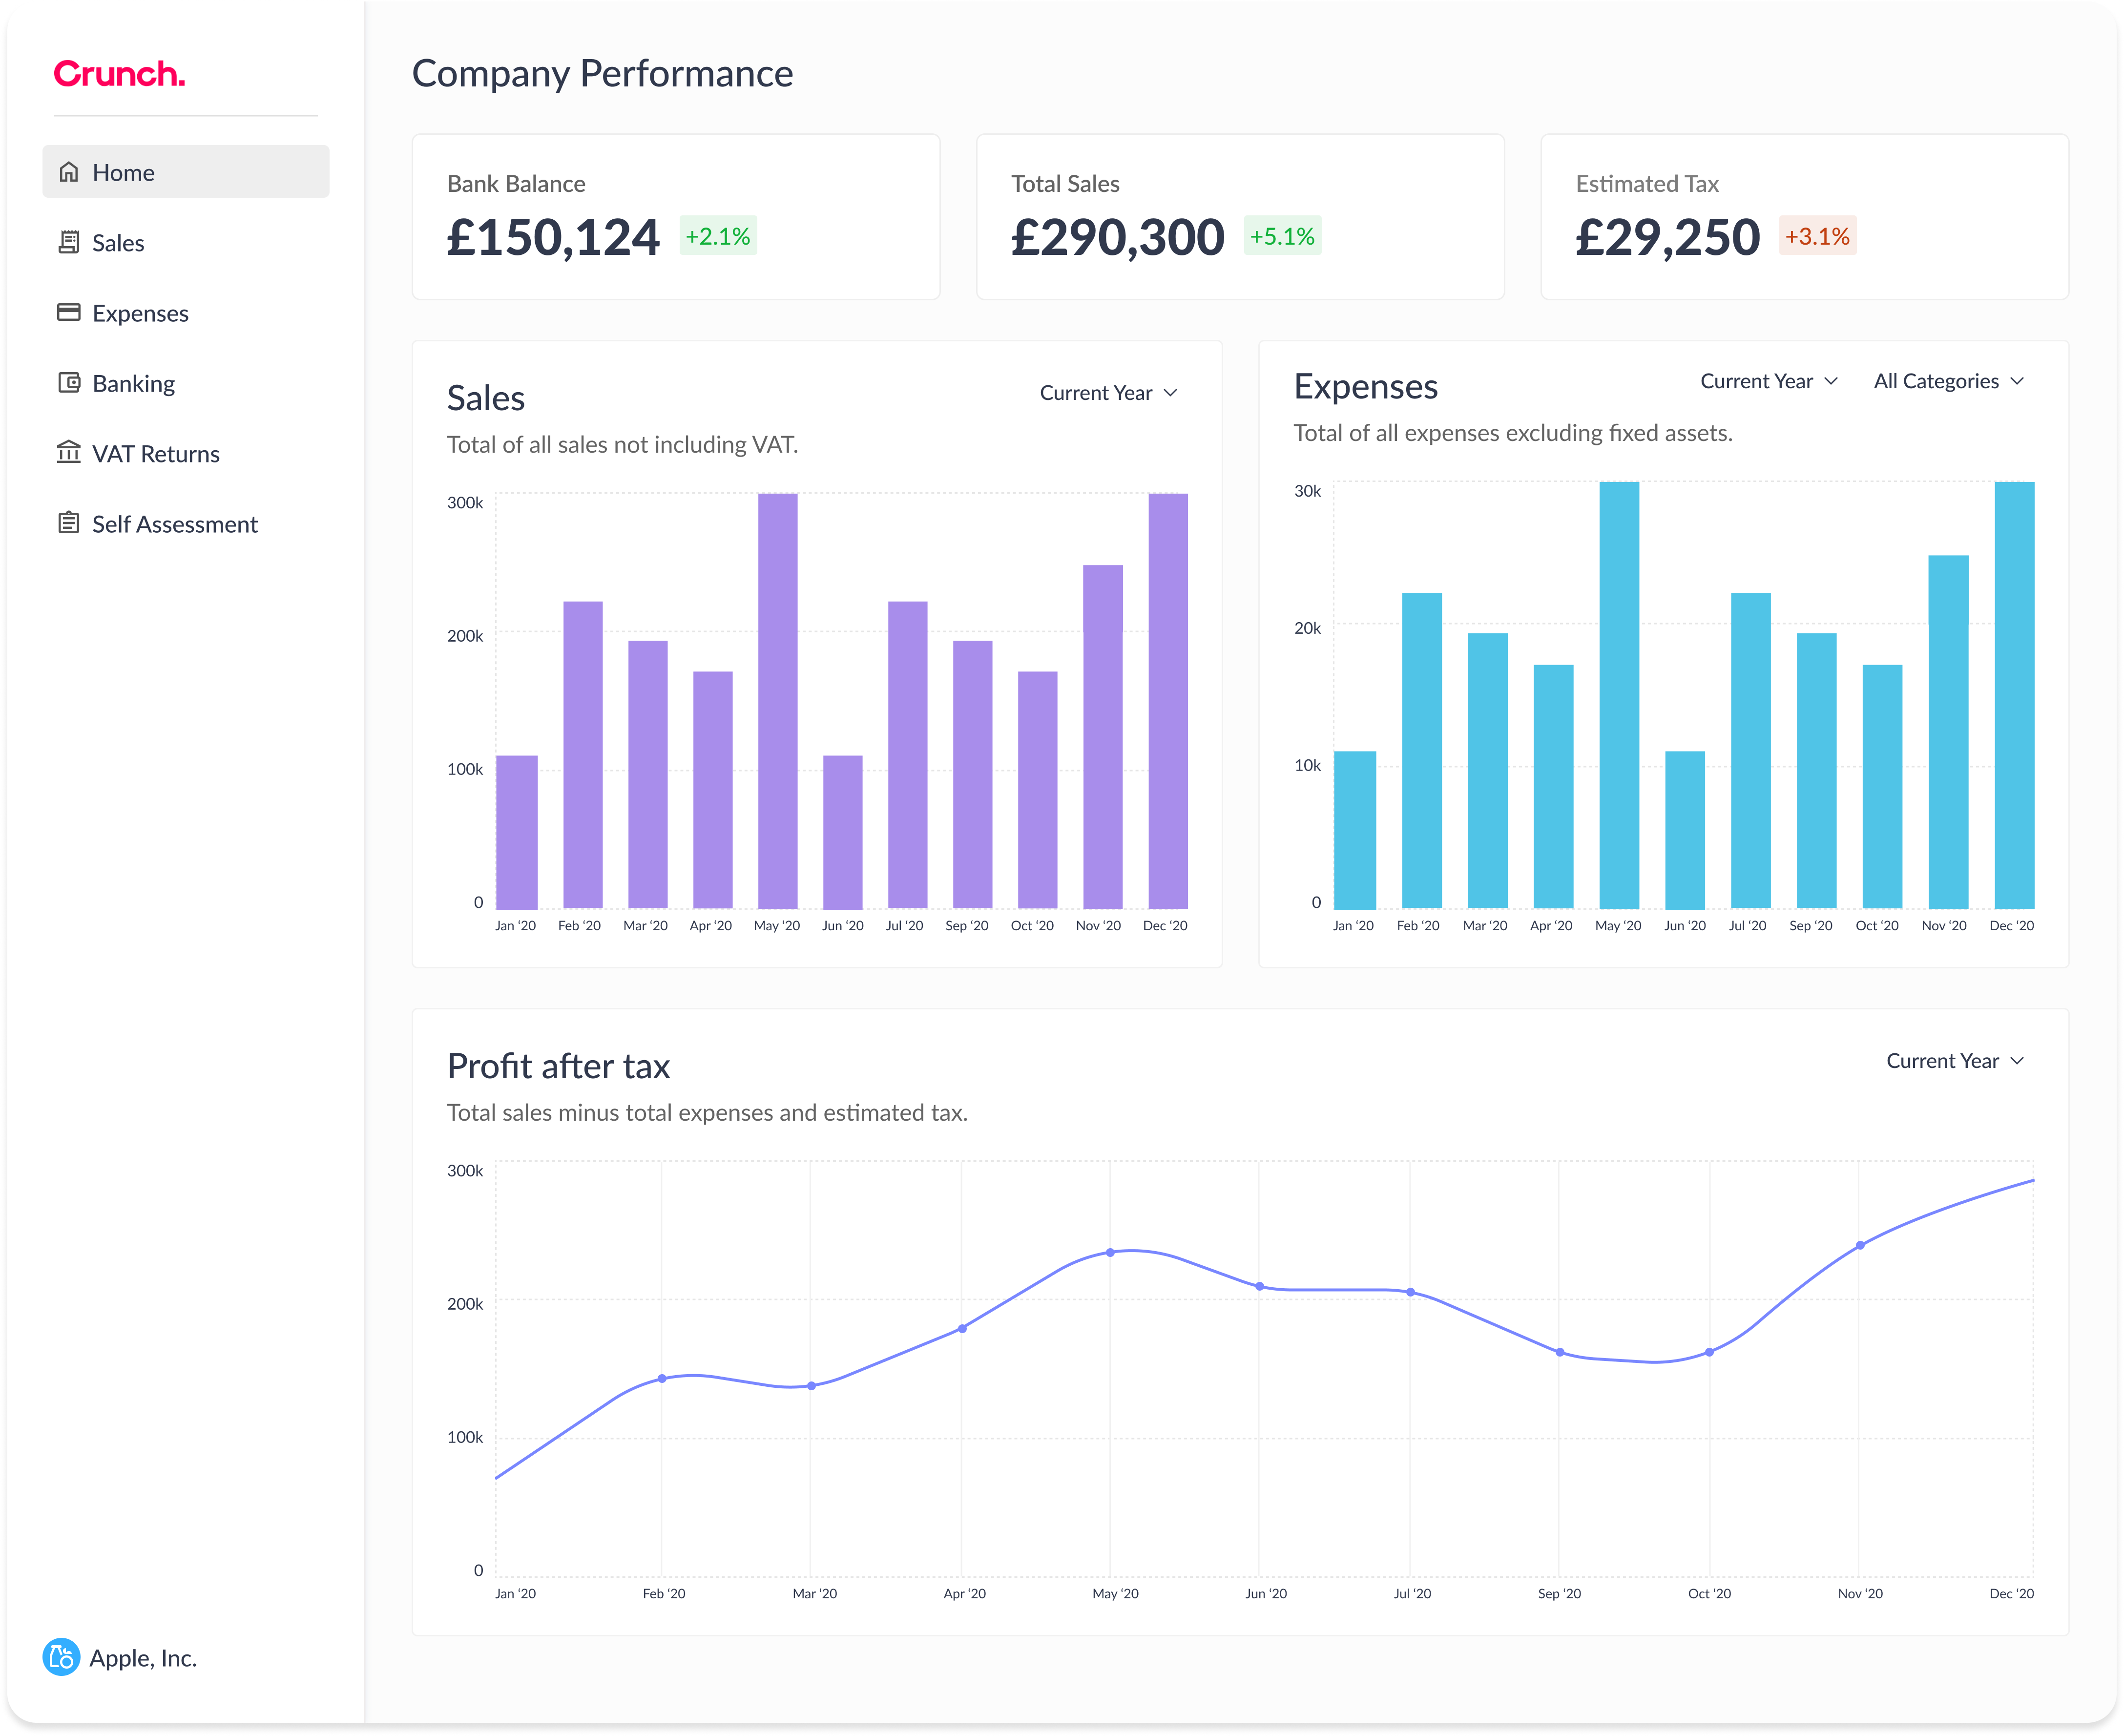
I designed a new dashboard helping Small Business owners quickly evaluate how their company is performing.
The goal was to help small business owners easily track their financials and plan for business growth and stability. I started by reviewing the existing graphs, which were displayed across different dashboards. The most frequently reported issue was that graphs refreshed their data every year — limiting historical visibility.
I investigated dashboards in Freshbooks, FreeAgent, QuickBooks and Xero. They showed 3–4 graphs, not overwhelming users. Charts focused on profit and loss, which aligned with what our users requested. I also looked at Mixpanel, Garmin Connect and Fitbit for broader insight into performance dashboard design.
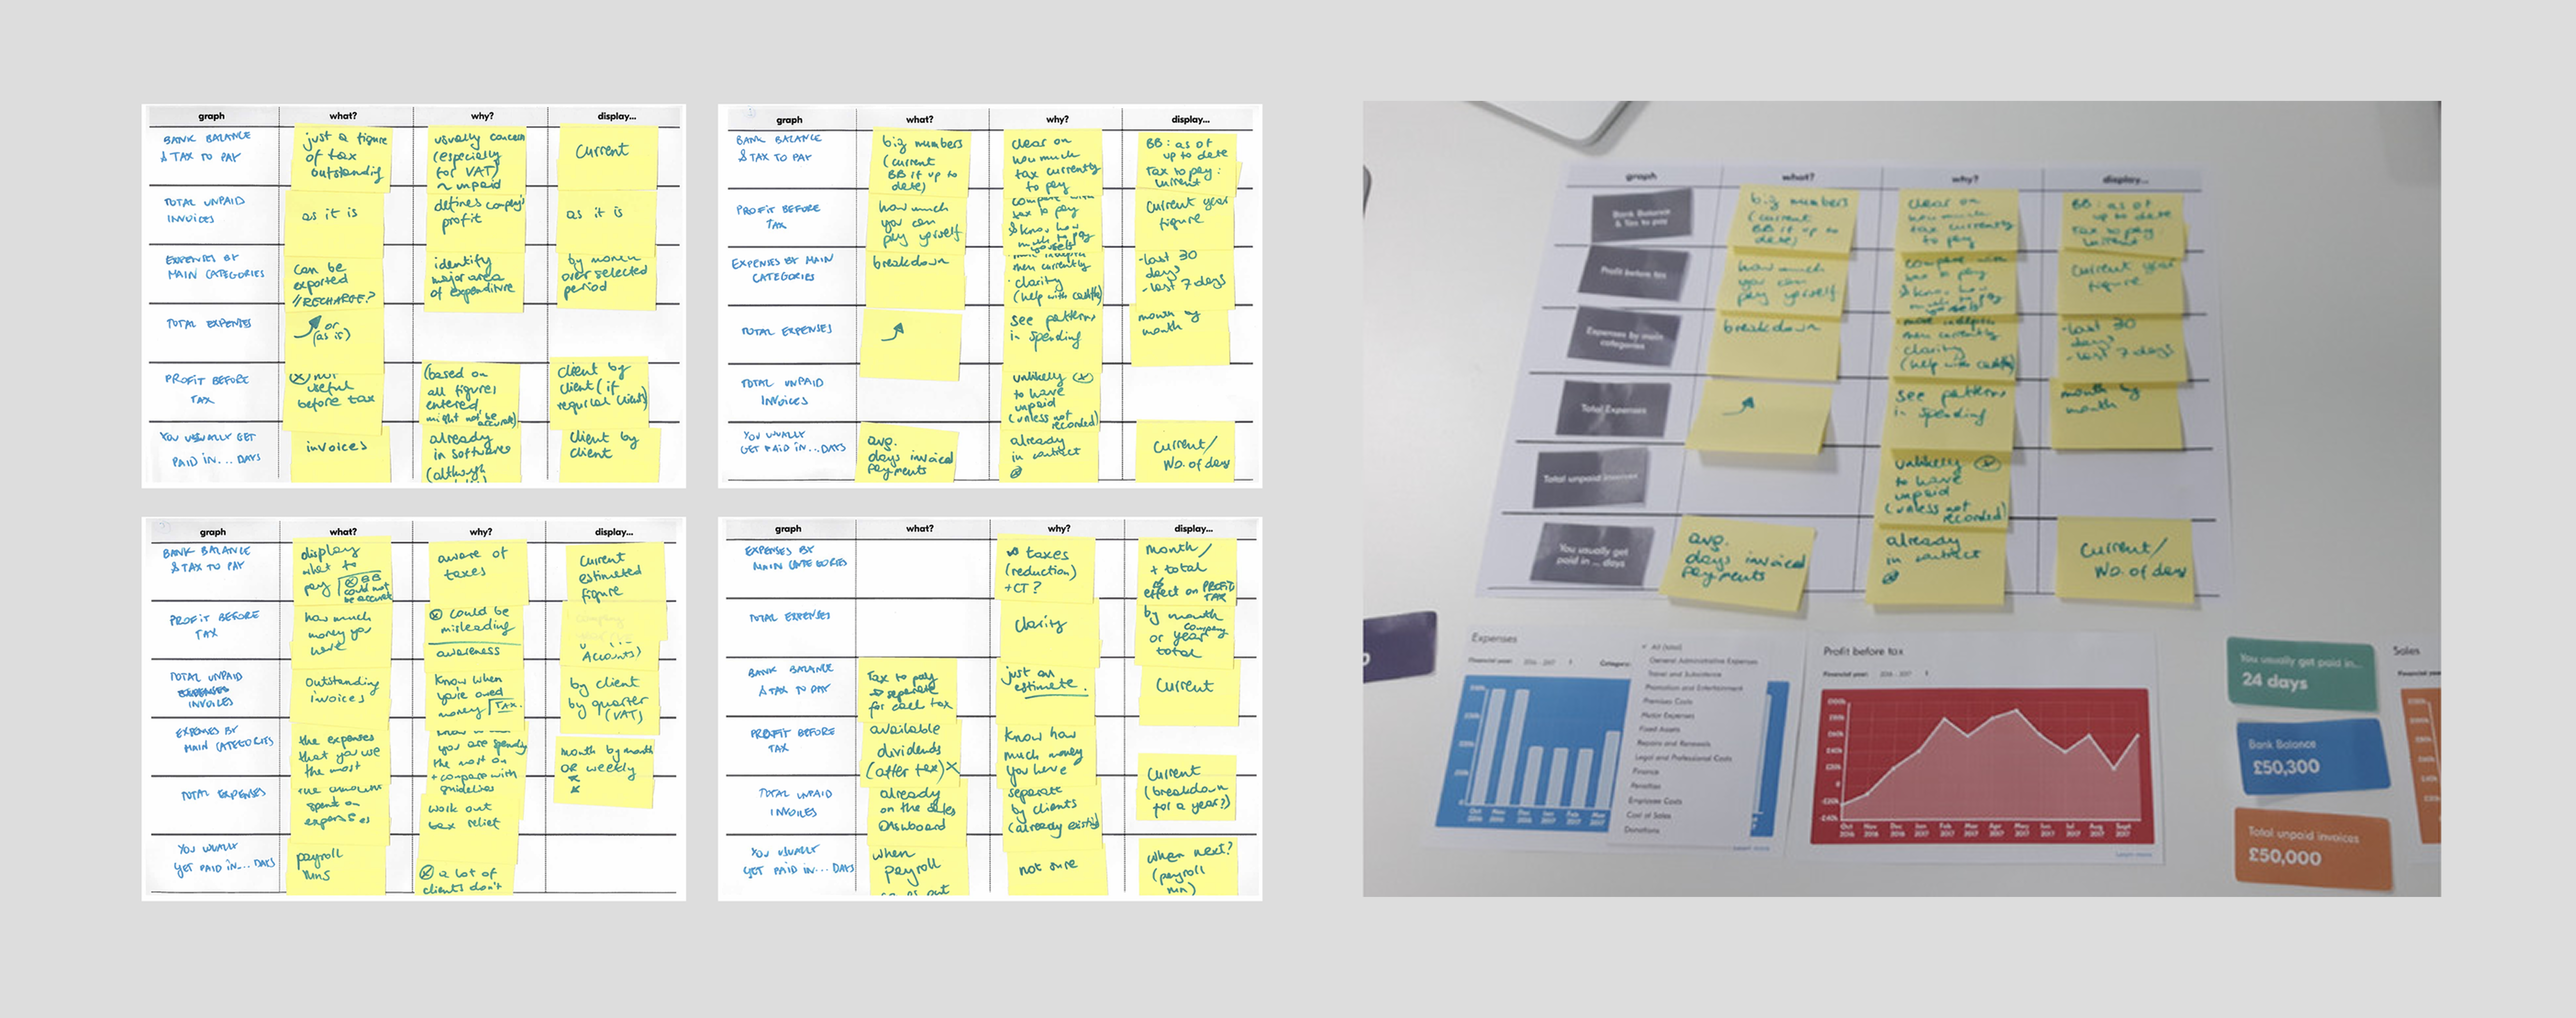
I ran a series of workshops with 5 in-house client managers and accountants to brainstorm ideas. I also conducted a user survey to validate what data would be most useful to small business owners.
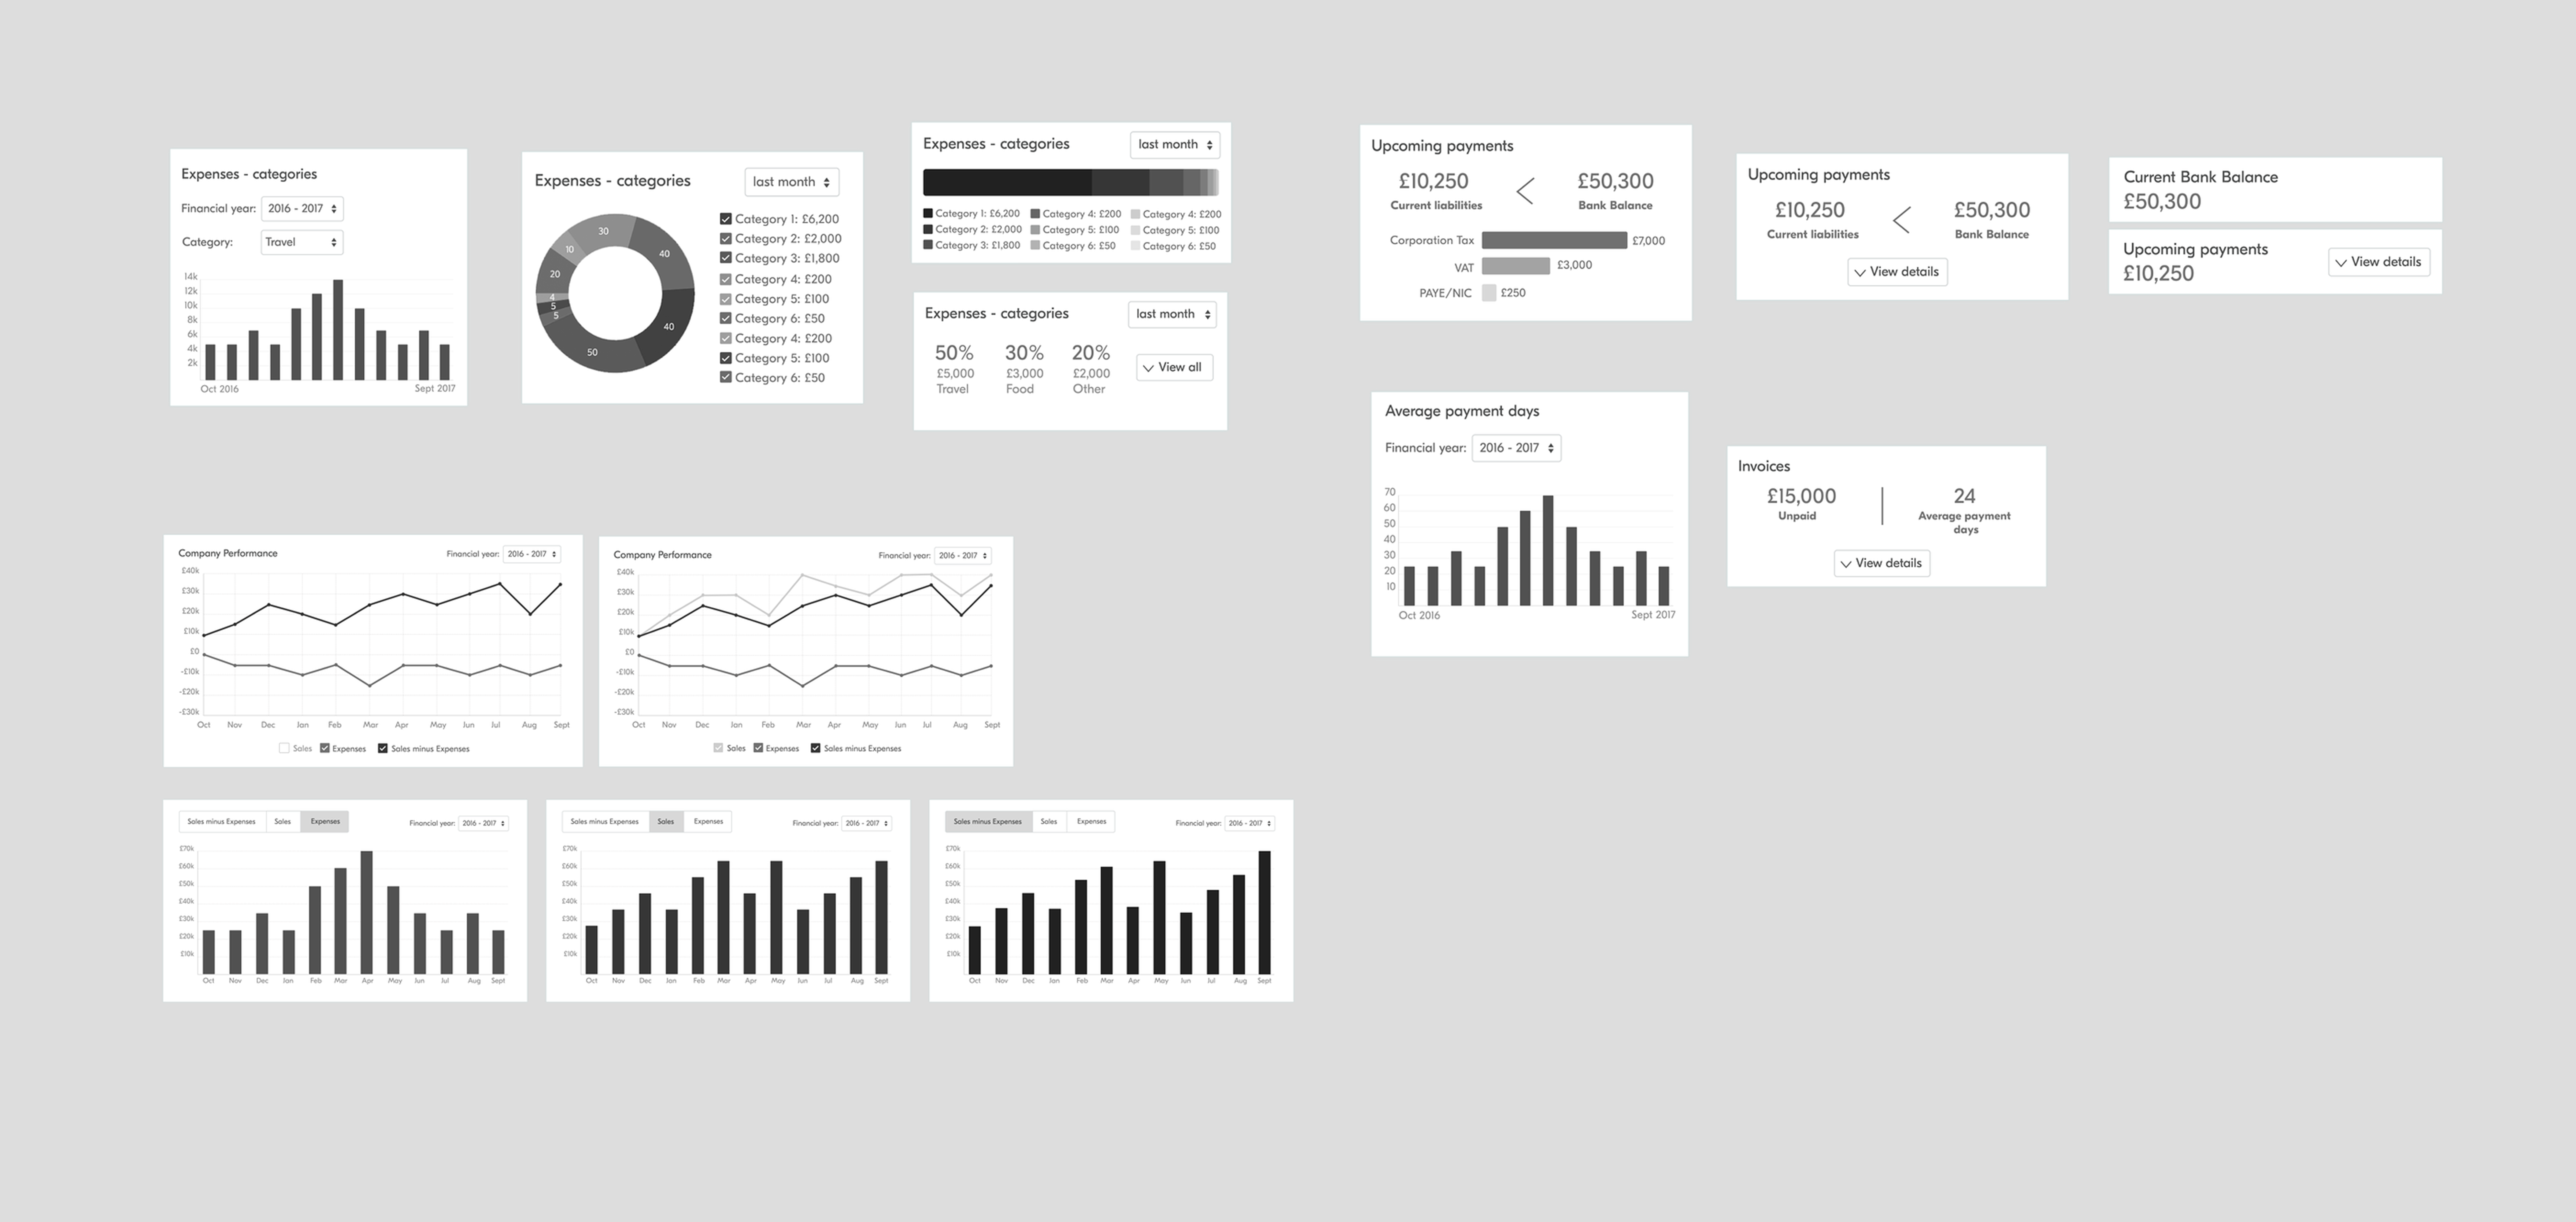
I created chart ideas based on initial research and conducted user testing to evaluate the prototypes. I learned that tax estimates should include a description explaining what affects the numbers, and that expenses by categories was voted as the most useful chart.
This project delivered a new dashboard helping users understand their company's performance and prepare for taxes. 46% of users voted the Sales chart as most helpful. If I had more time, I would explore drill-down functionality to help users quickly go deeper into their data.
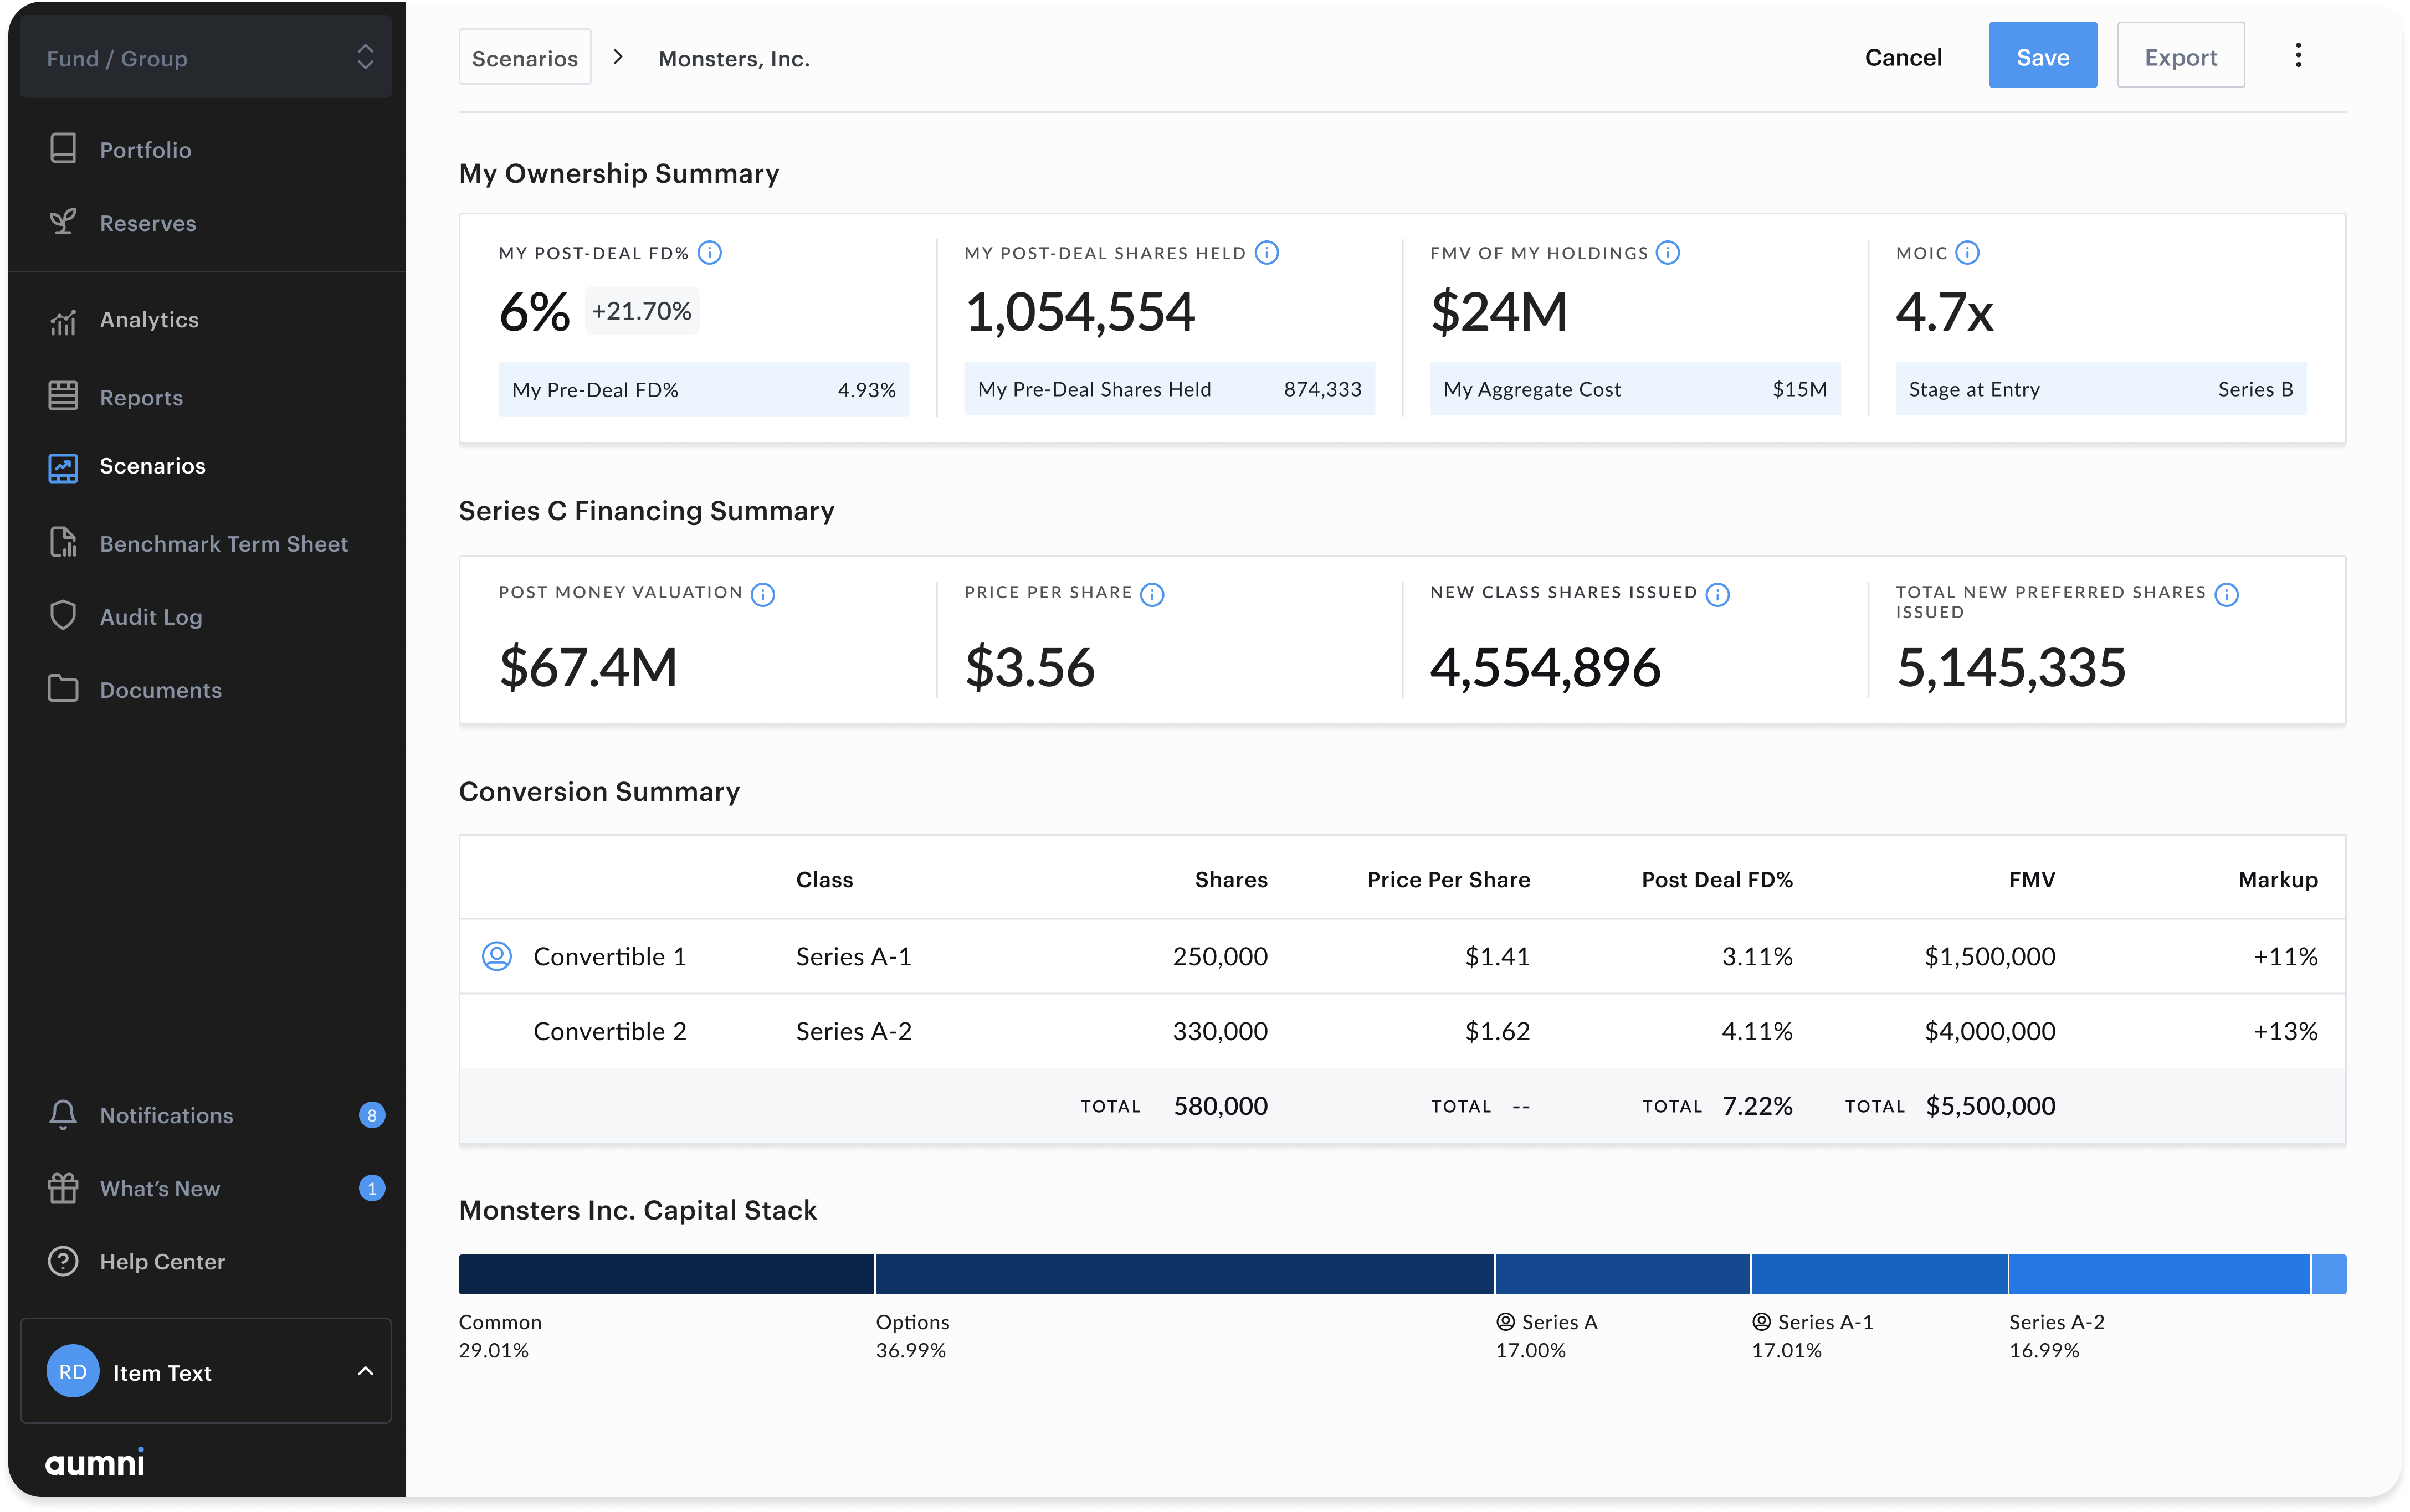
I designed a set of features that help investors evaluate fund terms, expanding Aumni's offering to a new customer segment.
View Project →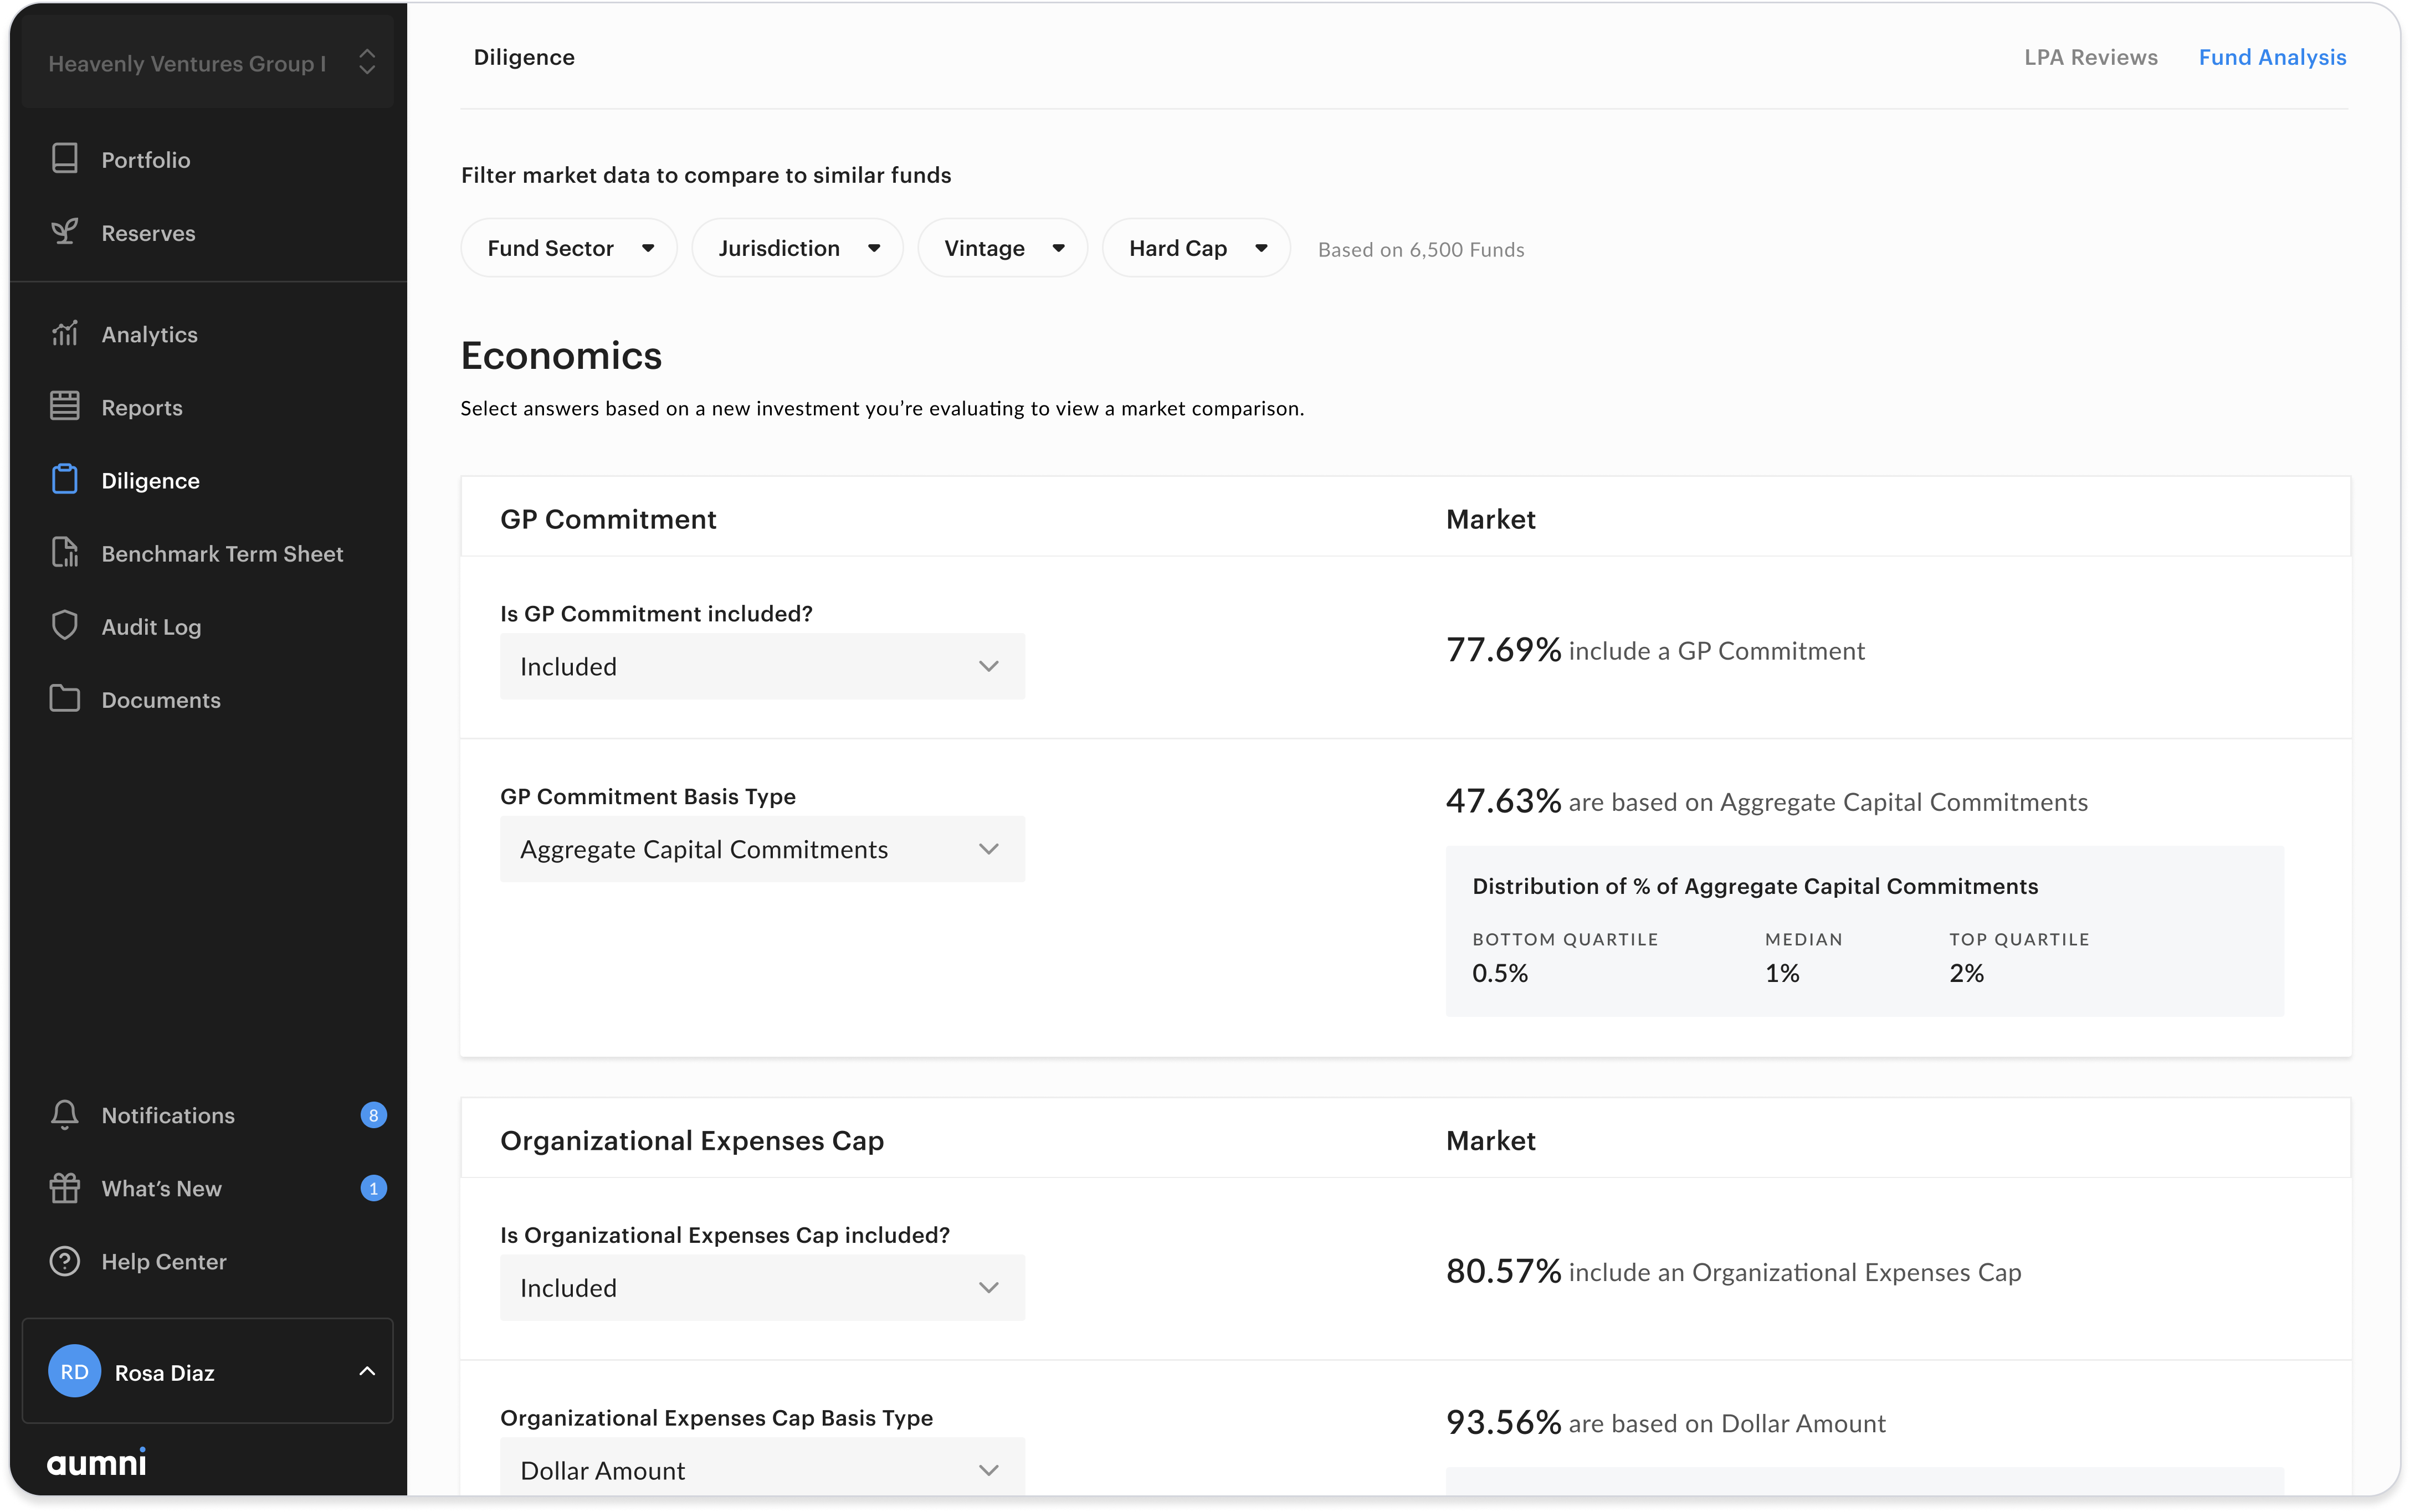
I designed a new Scenario Modeling feature, helping investors evaluate their portfolio and plan investment amounts.
View Project →